Case Study · Book of Earth

Digitizing a Century of
Oklahoma Well Records

571,446 scanned pages. One question buried in every one of them: where, exactly, is this well?

Oklahoma State University, Boone Pickens School of Geology · DOE Award DE-FE0032362 (Anadarko Basin Carbon Management Hub) · Data: Devon Energy · Jul 2025 – Jul 2026

571,446scanned records
113years of forms
51,559wells live on the map
77counties covered

▼ every story starts with paper

Book of Earth · Prologue

A Century of Paper

In 1911, when a crew finished drilling a well in Oklahoma, somebody filled out a form. They typed, or scrawled, the county, the Section–Township–Range legal description, and marked a dot on a little grid labeled "spot well correctly." Then the form went into a drawer. For a hundred and thirteen years, that's how Oklahoma remembered where its wells were.

Today, 571,446 of those "1002A" forms survive as scanned PDFs. Typed, handwritten, stamped, skewed, photocopied, faded. And they matter more than ever: finding orphaned, abandoned, and idle wells for carbon-management planning means turning every one of those pages into a point on a map: a latitude and a longitude.

At two minutes per record, transcribing the archive by hand is roughly nine person-years of work. Nobody was going to do that. The archive needed a machine that could read, and a way for humans to check its work.

Book of Earth · Chapter One

The Inheritance

Jul 12, 2025  My part of the story starts with an email. I wrote to Prof. Priyank Jaiswal at the Boone Pickens School of Geology asking about a volunteer research opportunity. His reply mentioned something else entirely: a student of his had started a computer-vision project and gone quiet. "Let me take another day to see if he responds."

Jul 19, 2025  The materials arrived: a Colab notebook that used Google Vision to find the "spot well" grid, a script that could extract one PDF at a time, a folium map, and one monumental asset: a 4.5-million-row database of Oklahoma's land-survey grid the previous researcher had painstakingly computed, down to quarter-quarter-mile squares. I said yes the next day.

I'll be honest about where I stood: computer vision was brand new to me. I knew neural networks and Python; I had never made a machine read a stamped, skewed 1930s form. And the diagnosis of what I'd inherited was sobering: a prototype that worked beautifully, one PDF at a time, in Colab. No batch processing. No crash recovery. No state tracking. No cloud. Between that prototype and 571,446 documents stood everything I was about to spend a year building.

Book of Earth · Chapter Two

Walls, and First Wins

The first wall was the database. That beautiful 4.5-million-row survey table would not load anywhere I could afford. Colab sessions died. My laptop's memory fell short. For close to six months I tried workaround after workaround, and every one failed. The fix, when it finally came, wasn't a cleverer loading trick; it was a different architecture: move the data into the cloud, stand it up as a proper database, and query it instead of loading it. That unlock made coordinate resolution possible at scale, and it was my real introduction to cloud engineering.

Oct 22, 2025  First win. I ran a standalone extraction pass over the modern reports the prototype produced: county, Section–Township–Range, GPS coordinates, out to spreadsheets, and built the first interactive well map, clustered markers on a Folium page, published from a little repo called Oklahoma-Well-Locations. I sent it to Prof. Jaiswal: "you can click on each well location and see the details." It was small. It was also the first time the archive talked back.

Nov – Dec 2025  In one of our project talks, the professor made the suggestion that changed the pipeline's future: stop hand-annotating the grid dots (render, squint, click, store the row and column, repeat) and teach a model to find them. At half-a-million-record scale, manual annotation was a dead end. I spent that winter studying a model built for exactly this, called U-Net.

Dec 2025  Then the archive itself arrived: thirteen ZIP files, ~571,000 scanned PDFs, 1911 to 2024. They still sit on my D: drive, a century of Oklahoma in thirteen folders. And they immediately exposed the truth the single-form prototype had never faced: a hundred years of changing paperwork. I spent months just studying where things sit on these pages, era by era. Sorted into piles, the century looks like this:

1911–1925The faded years

Handwritten, browned, photographed off old paper. The grid hides in the bottom corner of a big form.

1926–1940The hollow circles

The well is a little hollow "o" on the grid. A century later, it would blind a detector that had only ever seen filled dots.

1941–1979The typewriter era

Wartime forms settle into a clean typed standard: grid top-left, description beside it. The pipeline's happiest decades.

1980–2000The big-grid years

New agencies, bigger grids, more tables. The same dot, drawn a little differently, and the detector stumbles again.

2001–2024Paper disappears

Typed reports with no grid at all. The location is written out in words, and the county hides inside the well's serial number.

That study became the foundation of everything that followed. It also surfaced the pattern that shaped the whole design: failures cluster by era, not at random. A quirk breaks the same way across an entire decade, so fixing one quirk fixes thousands of records at once.
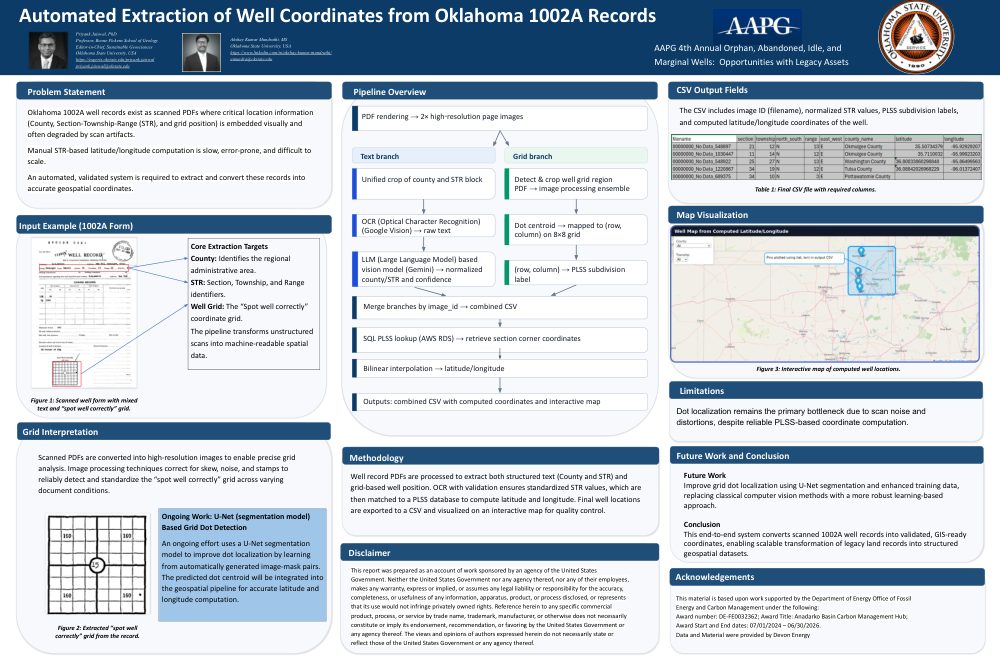
Feb – Mar 2026  Interlude: Tulsa. A data-flow deck became a plan: the professor gives the talk, I present the poster: "Automated Extraction of Well Coordinates from Oklahoma 1002A Records," at the AAPG 4th Annual Orphan, Abandoned, Idle, and Marginal Wells conference, March 2026. The work faced the world for the first time, with the U-Net detector listed, accurately, as ongoing work. AAPG 2026 poster: Automated Extraction of Well Coordinates from Oklahoma 1002A Records 🔍 Click to open the full poster (PDF) 🖼️ The poster (PDF) ↗ 📽️ The talk deck (PDF) ↗ original .pptx ⤓

Book of Earth · Chapter Three

Fifty-Nine Days

May 15, 2026  First commit of the production repository. Everything learned since July went into a modular pipeline: five extraction paths, one resumable ledger. In the first nine days it was benchmarked on 4,607 real records: grid detection 100%, county 99%, dot 89%. The shape of the machine is simple to say out loud. Earning it wasn't:

📄

A scanned page comes in

Every PDF is rendered into a crisp, high-resolution image, whether it was handwritten in 1911 or uploaded in 2024.

🔍

Five readers look at it

Each hunts for the well's location a different way, so every era of form has a path that works:

Printed coordinates The county The legal description The little grid The hand-drawn dot
🗺️

Words become a location

Whatever was read gets matched against 4.5 million land-survey cells, with the county as the master clue, until it resolves to a latitude and longitude.

🌱

The map grows

A ledger remembers every record's progress, so crashes resume instead of restarting, and each publish can only add wells, never lose them.

One rule, held everywhere: a shortcut may say where to look first, but it never gets to say "stop looking." If the expected spot comes up empty, the whole page gets searched; if an answer looks doubtful, it's marked doubtful instead of trusted. That's why a hundred years of changing forms bent the results without ever breaking them.

The build ran on an ordinary home laptop, and the laptop fought back. Long runs died silently; I traced the deaths through Windows event logs to memory exhaustion, not code. The fix was architectural: process the archive in fifty-record chunks, each in a fresh process that hands its memory back when it exits, with a ledger that lets any crashed run resume exactly where it stopped. That pattern ran 35,845-record campaigns crash-free at ~1,000 records an hour, through Wi-Fi drops, shutdowns, and restarts. Late May 2026  The same discipline went to the cloud, where the first cloud run put 2,439 more wells on the map while it was still going.

Building for crashes changed how I worked, too. One afternoon I left a self-healing watchdog in charge and came back five hours later to a report it had written for me. It had caught a quiet bug (a stale filter had been dropping valid wells from every map build before it), re-run the old failures, and taken the map from 1,615 wells to 4,778 in a single sitting. Reading a machine's honest summary of its own shift is a strange kind of joy.

The scariest moments weren't crashes. A consolidation script once truncated the 514,000-row tracker to 3,334 rows; an enrichment step overwrote the coordinates file. Both recovered from backups, and both were answered structurally: merge tools that can only add, never overwrite; map builds that can only grow; and a full reconciliation across disk, archive, tracker, and site, so every record exists exactly once, everywhere.

Book of Earth · Chapter Four

The Day the Map Exploded

Jun 16, 2026  The best decision of the project cost nothing. Staring at the "worst" collections (modern records where grid detection succeeded just 7% of the time), the realization landed: these aren't scans of paper, they're digital-native documents. The county is decodable from the API number, deterministically (35-011 → Blaine). The legal description is typed text. And about 31% print their exact coordinates. They never needed computer vision at all; they needed to be routed differently.

Routing by era turned the worst collections into the best: 88–98% mapped, for free, in minutes. The map jumped from 7,163 wells to 47,253 wells in a single day, at $0. In the days after: 12,662 wells upgraded to exact printed coordinates, and a ground-truth pass against the land-survey database caught a systematic mirror bug that had flipped ~2,000 wells to the wrong side of the state; direction, it turns out, is deterministic from the county alone in most of Oklahoma.

Field notes from half a million forms:

The problem is spatial, not typographic

Free OCR scored 0% location agreement on old scans; embedded PDF text, 0% on county despite "95% text coverage." Flat text loses page geometry: you can't tell the well's county from the operator's address without knowing where the words sit.

One bare number is the ceiling

Township and range anchor themselves with direction letters; the section is a bare number whose label OCR drops. Only 44% of the older records give up a complete description; the entire improvement agenda hangs on reading one number better.

Coordinates come from a ladder, not a lookup

Turning a messy legal description into a location is a ladder of attempts, cheapest first, with the county as the master clue; a missing direction letter can usually be recovered from the county alone. When every rung fails, the system says so instead of guessing.

Book of Earth · Chapter Five

The Map That Fixes Itself

Automation got the wells onto the map. Humans keep them honest, placed exactly where they're irreplaceable, and nowhere else.

Today the map holds 51,559 wells across all 77 counties, every pin linked to the original scan it came from, a living dataset that grows as eras are processed and corrections land.

What It Cost

The whole system runs on a handful of services, most of them free or nearly free:

The jobThe serviceThe detail
Reading the scansGoogle Cloud VisionAbout $1.50 per 1,000 pages; a cache of 118K already-read pages makes re-runs free
Cleaning county namesGemini (free tier)Free, with careful rate-limit handling
Turning descriptions into coordinatesPostGIS on AWS RDS4.5M land-survey cells covering the whole state
Keeping the archiveAmazon S3All 571,446 PDFs; every map pin links back to its original scan
Heavy processingAWS BatchCloud capacity approved; could finish the whole backlog in about 3 hours
Publishing the mapGitHub PagesFree; rebuilds can only add wells, never lose them
Total spent so far: roughly $600, about $300 on document reading and $300 on cloud storage and the database. Reading the remaining scans will take an estimated $1,570 more, and the pipeline is ready for it whenever the budget is.

Book of Earth · Chapter Six

What the Earth Taught

Every lesson here was paid for: a scar first, a principle second.

  1. Six months stuck on a database that wouldn't load. The fix wasn't a cleverer loading trick; it was moving the computation to the data, in the cloud. That wall is the moment a prototype must become infrastructure.
  2. The extraction problem is spatial, not typographic. Two rigorous pilots said "no" to free OCR and embedded text: hours spent, and a ~$1,500 mistake prevented. Cheap experiments before expensive convictions; honest negative results are profit.
  3. Route by format era, then optimize per route. The single decision worth the most wells per dollar cost nothing but the willingness to re-see the data. Look at what the documents are, not what the pipeline assumes.
  4. Two near-miss data losses. A truncated 514K-row tracker, an overwritten coordinates file; both recovered, both answered with additive-only merges and monotonic builds. At half-million-record scale, your tools must be unable to destroy data, by design.
  5. A cloud run almost shipped garbage. The container defaulted to the OCR engine the experiments had rejected; a pre-launch scrutiny pass caught it. Audit runtime defaults against your own findings before scaling.
  6. The site showed 148 counties in a 77-county state. Unnormalized strings split entities on the public map. Normalize at the publishing boundary, not just at extraction.
  7. Hints bound, never gate; and humans go where they're irreplaceable. Measured envelopes ordered the search without ever ending it, and 2,781 human-reviewed forms leveraged into half a million records. Fallback-everywhere survives a century of drift; one reconciled ledger keeps it true.

Book of Earth · Epilogue

The Story Isn't Over

About 470,000 older scans are queued for the cloud run, ready to go whenever the reading budget is. Accuracy keeps climbing for free through queued review campaigns, the U-Net goes back to school on the hollow-circle well marks of the 1920s–40s, and an AAPG Bulletin manuscript is drafted. The map grows; the corrections loop keeps it honest.

Working sessions are journaled as a running companion to the commit trail:

Jul 14, 2026

Cloud-native hardening & cost-control review ↗

A full review of the pipeline ahead of the big cloud run: robustness confirmed, a county-based fix wired into the coordinate resolver, and a pre-launch bug caught that would have sent the wrong reading engine to the cloud. The session also settled what finishing actually costs, and sketched how the free parts can pace themselves automatically.

Browse all session logs on GitHub ↗

Required Notices

Acknowledgements & Disclaimer

Acknowledgements. This material is based upon work supported by the Department of Energy Office of Fossil Energy and Carbon Management under the following: Award Number: DE-FE0032362; Award Title: Anadarko Basin Carbon Management Hub; Award Start and End Dates: 07/01/2024 – 06/30/2026. Data and material were provided by Devon Energy.

Disclaimer. This report was prepared as an account of work sponsored by an agency of the United States Government. Neither the United States Government nor any agency thereof, nor any of their employees, makes any warranty, express or implied, or assumes any legal liability or responsibility for the accuracy, completeness, or usefulness of any information, apparatus, product, or process disclosed, or represents that its use would not infringe privately owned rights. Reference herein to any specific commercial product, process, or service by trade name, trademark, manufacturer, or otherwise does not necessarily constitute or imply its endorsement, recommendation, or favoring by the United States Government or any agency thereof. The views and opinions of authors expressed herein do not necessarily state or reflect those of the United States Government or any agency thereof.